
App Analytics Prototypes
Quickbase
Goal:
App Analytics aims to provide Quickbase users visibility into how data is flowing within and across Quickbase apps, as well as display key insights into end-user app usage.
Process:
Designed Quickbase's new App Analytics feature, starting from initial user research, to prototyping, validation, and implementation.

Role
UX Designer,
UX Researcher
Methods
UX Customer Workshop,
User Interviews, Data Analysis
Tools
Figma, Miro,
Balsamiq
Overview
As Quickbase app builders create and govern ecosystems of applications for their organizations, it is imperative that they have visibility into how their apps are being utilized by their end-users.
The new App Analytics feature aims to provide app builders insight into:
-
How data and applications are connected across their ecosystem
-
Which apps are used the most by end-users
-
How to maintain and govern their apps to optimize usage
-
Ways they can continue to provide valuable apps for their organization
My Role
My role during this project was as lead UX Designer and Researcher.
I was involved with the following stages of this project:
-
Creation of the UX customer workshop
-
Wireframing and prototyping
-
Usability testing for validation
-
Iterative wireframing and prototyping
-
Scoping for development
-
Implementation
The Process
UX Customer Workshop
In order to understand the current pain points of our app builders, I developed and conducted a UX customer workshop consisting of 7 enterprise-level customers. The workshop was structured as a mini design sprint, where I used the following methodologies (adapted from Google's Design Sprint Kit):
-
How Might We? (HMW)
-
Affinity Mapping
-
HMW Dot Voting
-
Crazy 4's
-
Crazy 4's Sharing and Voting
-
Solution Sketch
-
Presentation of Solution Sketches
-
$100 Test
.jpg)
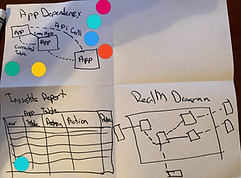

By the end of the workshop, two main problem statements were uncovered:
-
Visibility into the data connections within individual apps and across the entire app ecosystem is very difficult.
This causes builders frustration when they are trying to troubleshoot, build, and edit their apps.
-
App builders struggle to understand if their apps are being used by their end-users, and at what frequency.
Without this knowledge, app builders can't determine if they should keep, delete, or enhance their apps.
Wireframing and Prototyping
Based on the problem statements listed above, I wireframed and prototyped a first iteration of App Analytics in order to get feedback from the users who participated in the workshop.
Usability Testing
I usability tested the first iteration of the App analytics prototype with the 7 customers who participated in the workshop.
Iterative Design
Additional iterations of the App Analytics wireframes and prototypes were designed in Balsamiq and Figma.
Scoping with Product Managers and Engineers
After the final high-fidelity prototype was complete, I shared my specs and requirements with the team's product manager and tech lead in order to begin implementation.
Implementation within Quickbase
Once all of the necessary development stories were completed in Jira, the engineering team worked to implement App Analytics for Quickbase's app builders to use.
The Design
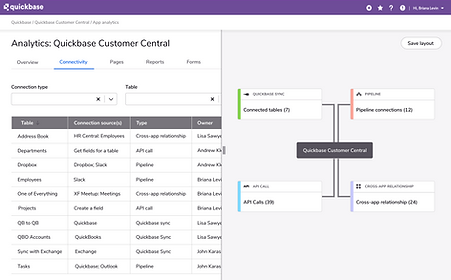
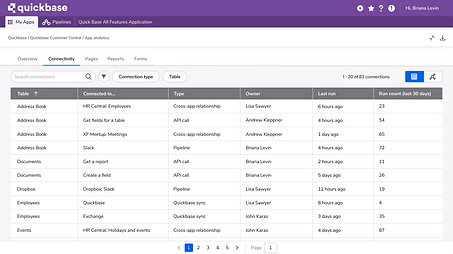
The below design shows examples of the wireframe prototype iterations created for App Analytics in Figma.
Some primary areas of focus:
-
An accessible way for keyboard-only users to access the data within App Analytics
-
A segmented control to view the data in tabular and graphical format so it can be best consumed by all learners
-
Filters and sorting functionality to aggregate and narrow down information
-
Fly-out panels (for the tabular layout) or expandable cards (for the graphical layout) to show detailed information
Iteration 1 (Pre-Validation Testing)

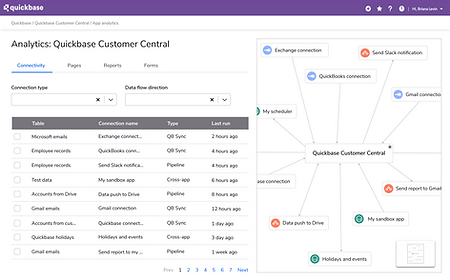
Iterations 2 & 3 (Post-Validation Testing)


.png)
Current Design: Tabular Format


Current Design: Graphical Format


Limitations and Challenges
Throughout the creation of App Analytics, limitations and challenges arose, such as:
-
We only had the opportunity to conduct the workshop and usability sessions with 7 participants. While we had valuable findings, we did not have representation across all types of app builders.
-
Roadmap and team changes slowed down the implementation of App Analytics, so development on the MVP of this feature is still underway.
-
Due to COVID-19, the workshop was conducted remotely using Zoom and Miro. Hosting the workshop in person would have allowed for better collaboration across participants.
Results and Reflection
As I reflect on my experience with this project so far, I believe that the direct user feedback from the workshop was imperative, as without it, users would not have been provided the information they valued and needed most. Overall, the experience of designing a Quickbase feature from concept to completion was an exciting endeavor that I believe will provide a lot of value going forward for our app builders. I am excited to see how this feature evolves as it continues to be developed.
Below are some notable recognitions from senior-level executives at Quickbase:
"Briana led one of the most innovative experiences I’ve seen in my time working at Quickbase. She scoped, designed, and flawlessly executed a jammed-packed 4-hour Design workshop with 7 high-value customers... This workshop focused on rapidly uncovering and prioritizing what our customers biggest desires & pain-points are related to the murky concept of 'app analytics'.. It is experiences like this workshop that keep our customers invigorated when they champion Quickbase at their respective companies. And from a Product perspective, it’s dedication like Briana showcased that helps us bring (the right) innovation to market, sooner."
-Senior Product Manager
"Briana - thank YOU for the leadership and execution... I could not be more thrilled with the clearly customer-centric approach that you led in helping guide influence and input to our roadmap and approach."
-Chief Product and Technology Officer
"Briana, I was shown the working canvas that you used to facilitate the workshop and I was quite impressed. Really great stuff here, and the customer obsession is clearly evident."
-VP of Engineering
As the team continues working to develop the MVP of App Analytics, some next steps would include:
-
Continuing to evolve the design of App Analytics based on additional rounds of user testing.
-
Prioritizing accessibility so that keyboard-only users and users that rely on screen readers can easily access the information within App Analytics.
-
Working cross-functionally with product management to prioritize App Analytics within our company's roadmap.